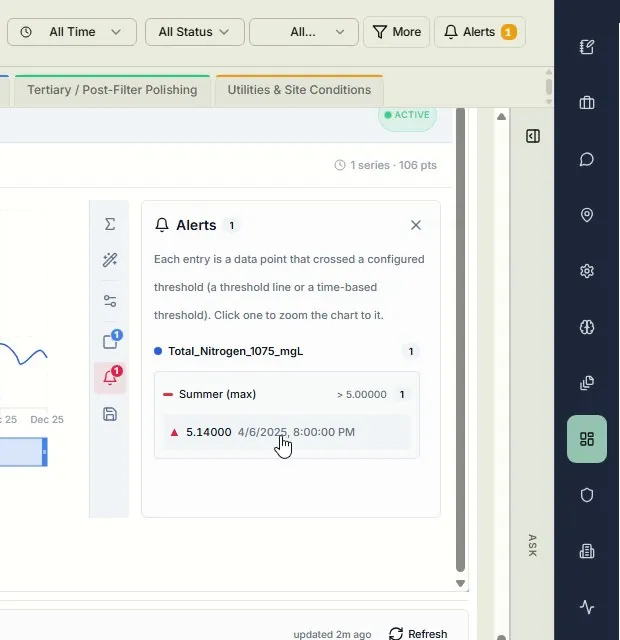
Alarms that point to the cause
Permit thresholds are built in. Click an alarm to jump straight to the point where the limit was crossed.

TeamSolve works on top of the WIMS you already have. Permit limits on every chart, alarms that point to the cause, MOR tables built for you, and notes that carry over from one shift to the next. Easy to learn, with no new data entry.
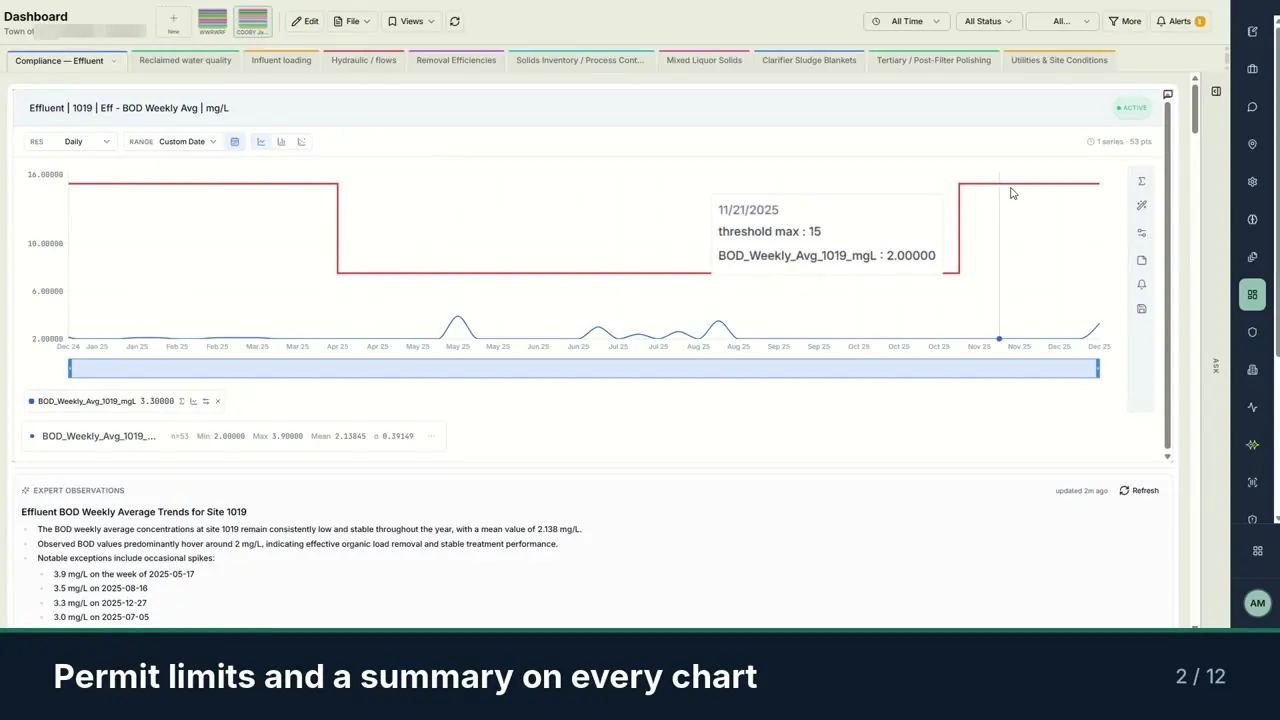
Operators go from a number on a chart to the reason behind it, without exporting data or digging through binders.
Permit thresholds are built in. Click an alarm to jump straight to the point where the limit was crossed.
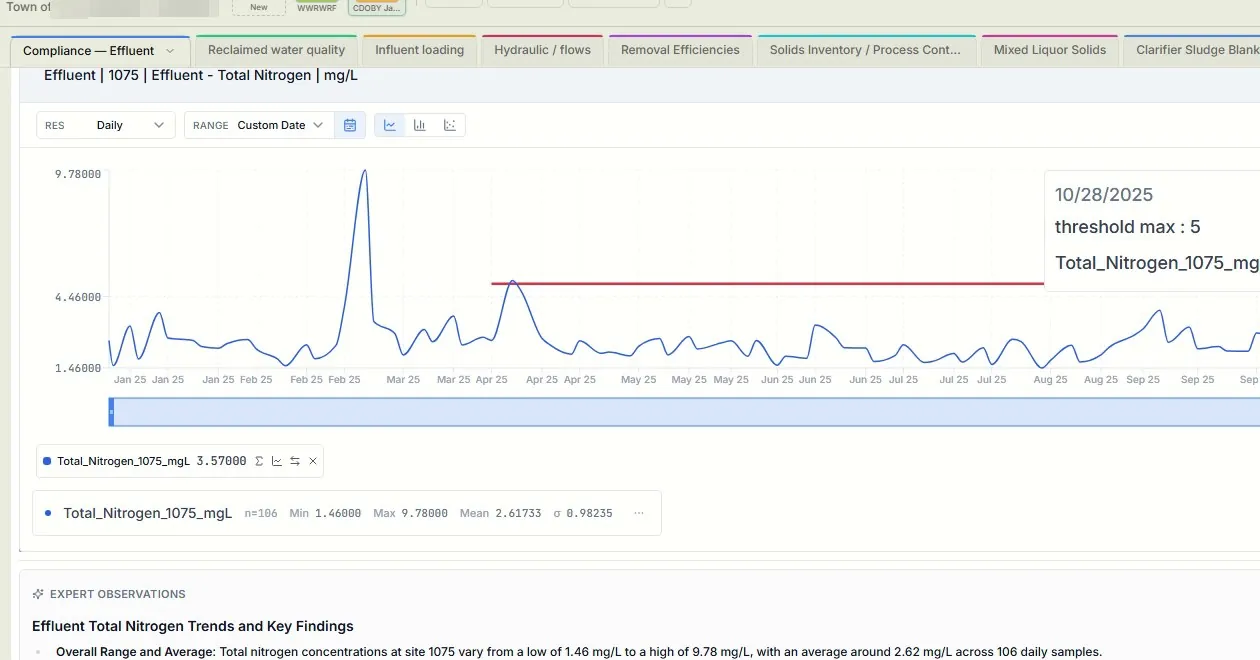
Explain an anomaly right on the data point. Back after days off, the next operator sees why it happened.
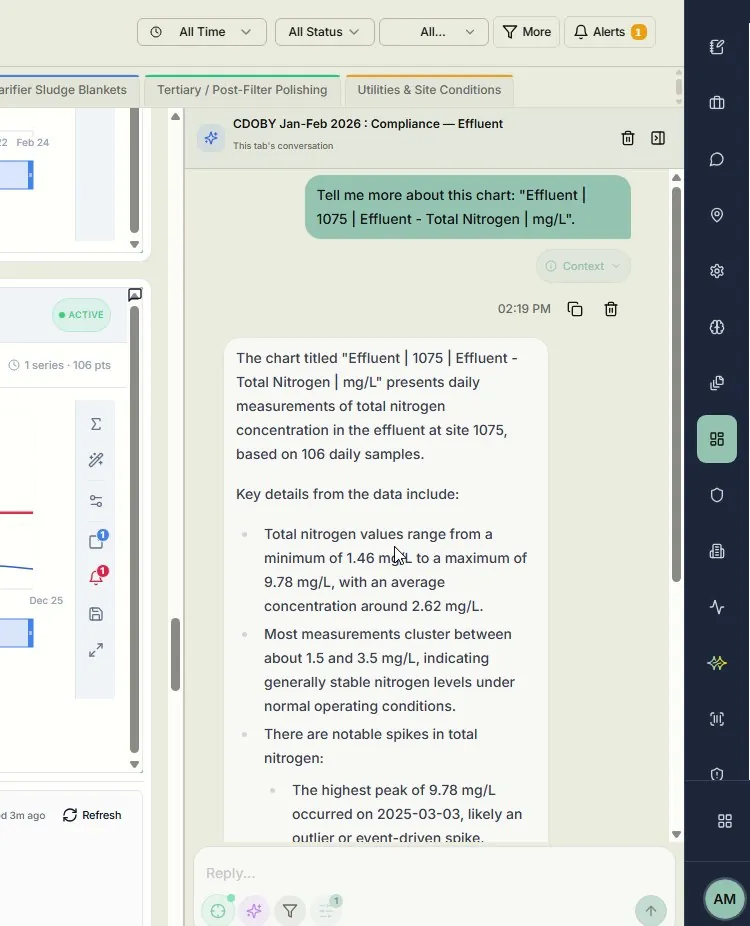
Type a question about any chart in plain English. The answer points to the load change or process upset behind a spike.
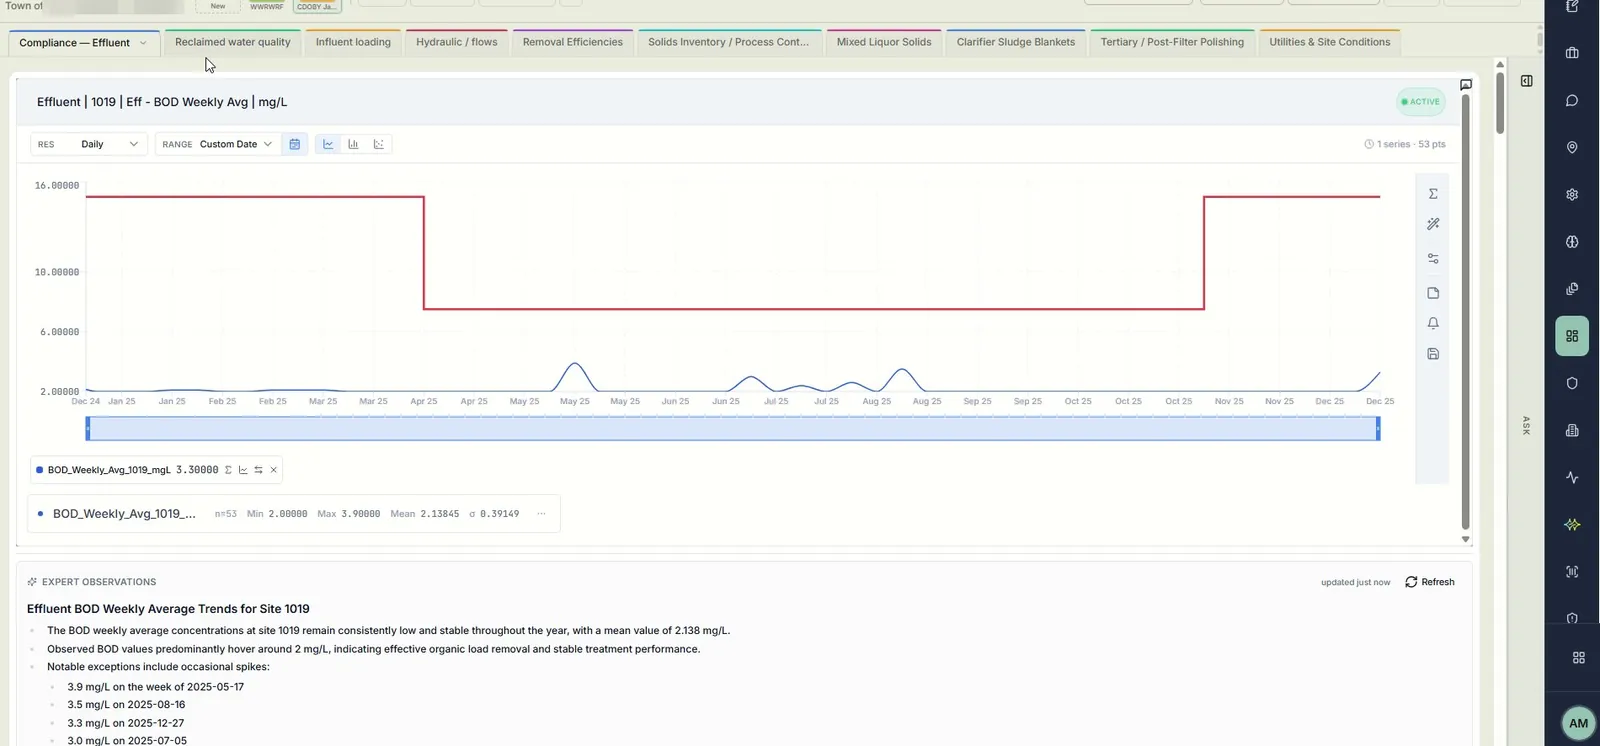
Parameters organized by compliance, influent and loading, with permit limits drawn on every chart and a plain-language summary of what changed.
Daily WIMS values land in one table, with sums, averages, minimums, maximums and geometric means calculated for you. Sludge results are summarized in plain language, flagging what stands out, such as high copper.
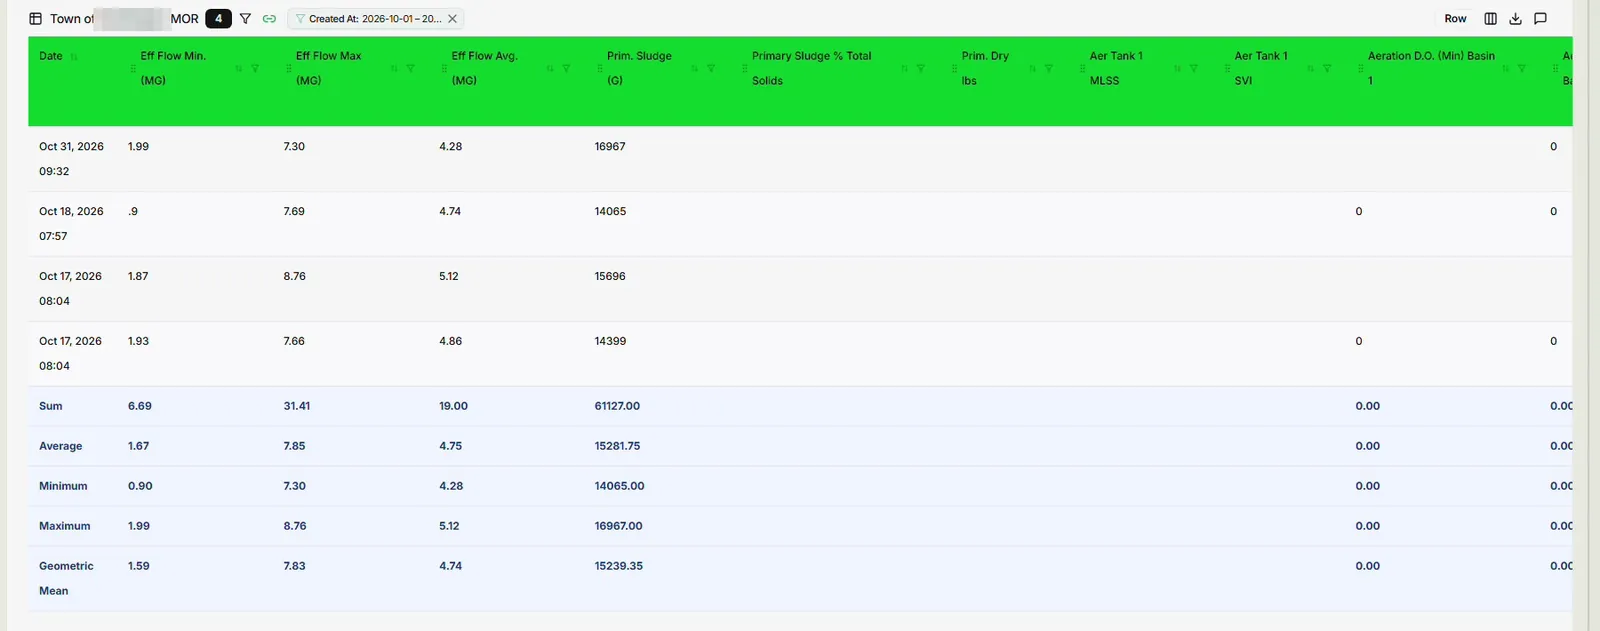
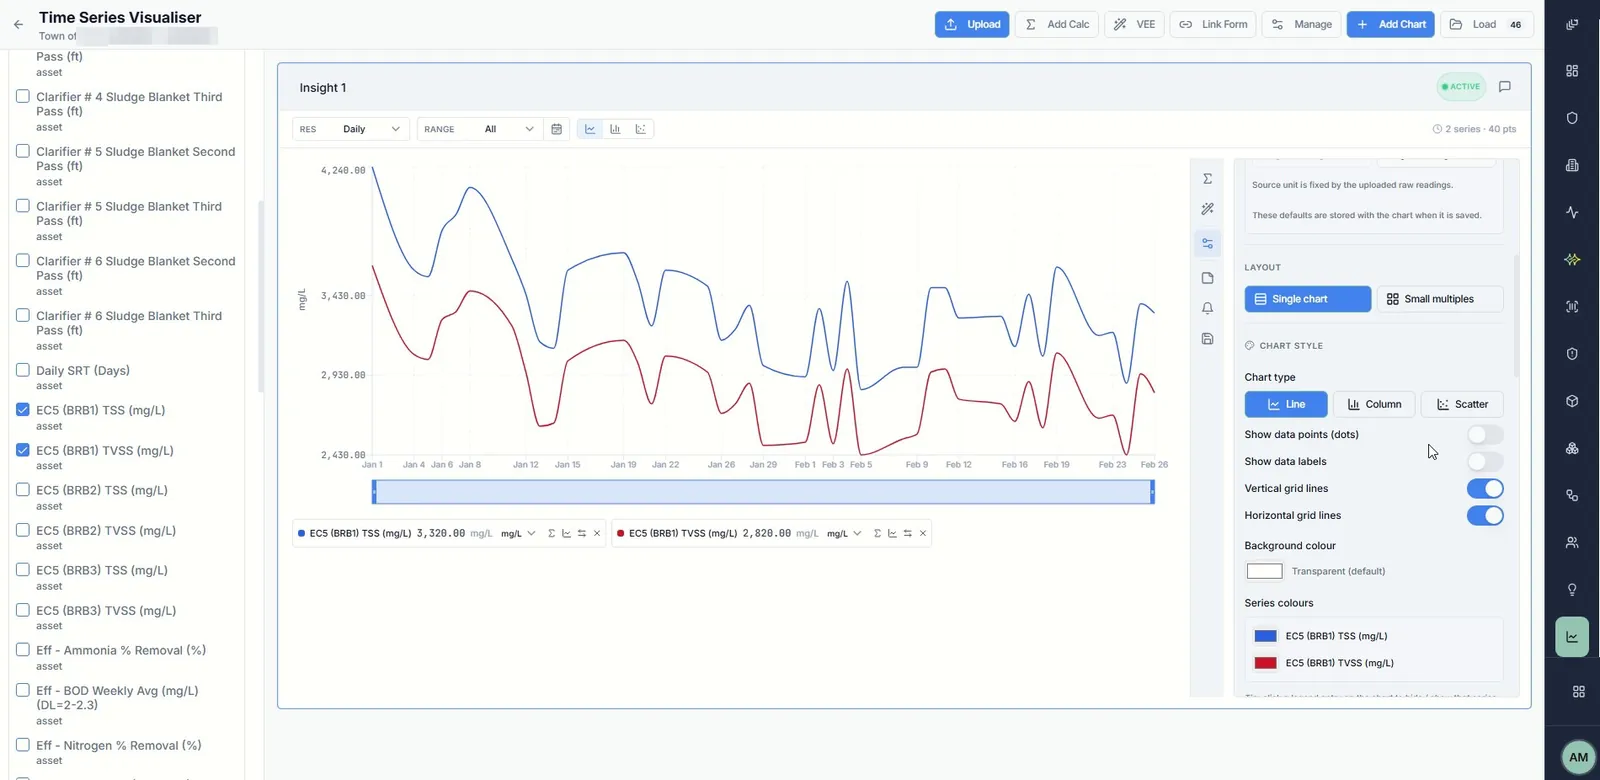
Chart any WIMS series side by side and add your own thresholds and limits. Maintenance records sit next to process data, and your permits, SOPs and daily logs answer questions with the page they came from.
Most plant software was designed for the office and then handed to the people running the process. TeamSolve was built around how operators actually work, so they use it.
Familiar charts and plain-language questions. New operators find answers on their own instead of waiting for a senior colleague.
Data arrives every day on its own. MOR math, permit checks and alarms happen automatically.
Nothing to rip out and no migration. WIMS stays your system of record.
Notes and know-how are captured on the data, so they do not leave when a veteran operator retires.
Permit limits are watched for you, and every alarm takes you straight to the data behind it.
Real results without enterprise-scale cost, consultants or a big IT project.
WIMS stores your data. TeamSolve puts it to work.
| WIMS alone | WIMS + TeamSolve | |
|---|---|---|
| Data | Lab and process data in WIMS | Lab, SCADA, work orders and documents together |
| Reporting | Manual charts and write-ups | Written summary on every chart, MOR and sludge table |
| Team knowledge | Lives in people's heads | Shared notes on the data, across every shift |
| Analysis | Fixed views | Your own thresholds, limits and charts |
| SOPs and permits | Search through PDFs | Ask in plain language, get the source page |
What one operator figures out becomes available to everyone, so everyday work takes less effort and new staff get up to speed sooner.
A scheduled WIMS report emails a daily file to TeamSolve. No integration project on your side.
It lands next to your other sources: SCADA, work orders, permits, SOPs and logs.
Charts, alarms and answers update on their own. No new data entry.
Pacifica selected TeamSolve to connect its WIMS lab and process data with permit compliance alerts, put its SOPs within reach of every operator for onboarding and training, and replace paper daily logs with a digital operations log.
"Customer quote goes here."Name, Title, Utility
We are happy to connect you with a reference customer once we understand your needs.
Ask for a reference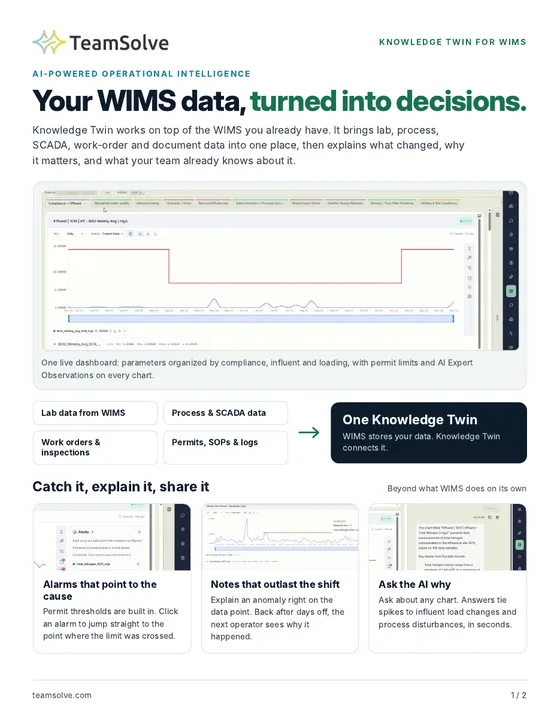
A two-page summary you can forward to operations, IT and management:
A short product walkthrough with on-screen captions. Easy to watch at your desk or share in a meeting.
Play the videoNo. It works on top of the WIMS you already have. WIMS stays your system of record.
A scheduled WIMS report emails a daily file to TeamSolve. Charts and alarms update automatically, and your staff do not enter anything twice.
TeamSolve connects through a scheduled export, a feature available in common WIMS products such as Hach WIMS. If your lab or process data system can send a scheduled export, we can usually connect it. Tell us what you run and we will confirm.
It is designed to be learned on the job, not in a classroom. Operators see the same kind of charts they know, and ask questions in plain English. Our team trains your staff on your own plant's data.
Yes. Daily WIMS values are organized in one table with sums, averages, minimums, maximums and geometric means calculated for you, ready for your team to review.
Some features, such as plain-language answers and written chart summaries, use AI behind the scenes. Every answer points back to your own data and documents so staff can check it, and your data is never shared with other customers.
TeamSolve holds ISO 27001 and SOC 2 Type II certifications.
Yes. Request a demo and ask about a trial on your own WIMS data.
A 30-minute walkthrough with our team, using examples close to how your utility works.
Prefer email? Write to info@teamsolve.com.